OBD2 Fault Codes -
Good CAT, Bad CAT
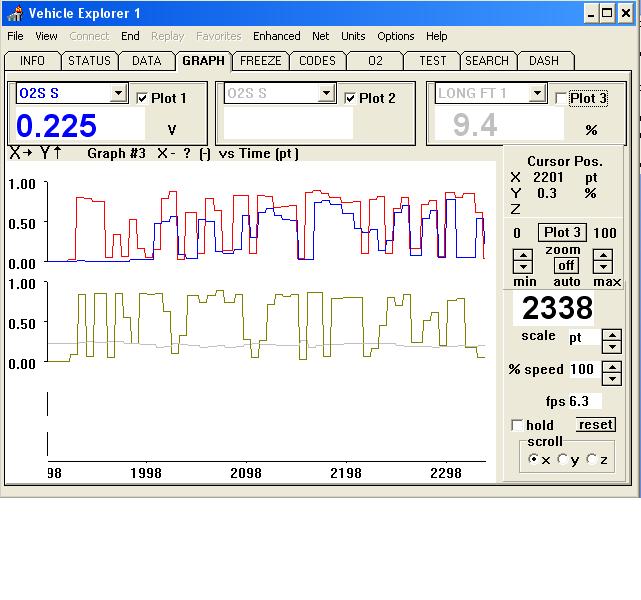
A good example of the Catalyst Monitor on OBD II is shown on
this scan from Mike W.
Mike had just had the nearside catalyst replaced on his 24V Cosworth and with
the latest scan he wondered if there was something wrong with it, but in fact
his scan was the perfect example of one good and one failing catalyst all on the
same graph. Below is a sample of the graph from Mike's scan.

The top plot shows the reading from Bank 1 (drivers side of the engine,
cylinders 1,2 and 3.) The red line is always the upstream sensor (HO2S11) and
the blue trace is the reading from the downstream post cat sensor, HO2S12. The
upstream sensor shows switching from a high to low reading , but so does the
post-catalyst sensor. If the catalyst were working properly, the reading from
the post cat sensor would be an almost steady line, with a very slow switching
rate.
And, on the lower plot, the good catalyst. This shows clearly as the one which
has been replaced. The upstream sensor HO2S21 shows much the same switching here
as on Bank 1 (brown trace) but the grey line (HO2S22) shows the steady, slow
switching of a healthy catalyst.
There is no telling how long the Bank 1 catalyst will last
before it starts to generate DTCs (Diagnostic Trouble Codes.) When the ratio of
Upstream to Downstream sensor switching approaches 75% then the Catalyst Monitor
will store the long-term DTC P4020 Catalyst Efficiency Below Threshold Bank 1.
On later EOBD equipped cars the Malfunction Indicator Light (MIL) would
illuminate, but although the EECV is capable of switching on this light, it was
not installed on the Scorpio. For us, there is no evidence of this, except that
CO and HC levels will be high enough to fail the emission check on the next MOT.
Thanks to Mike for the Scan

![]()
